


The Unwanted Call Index 2026
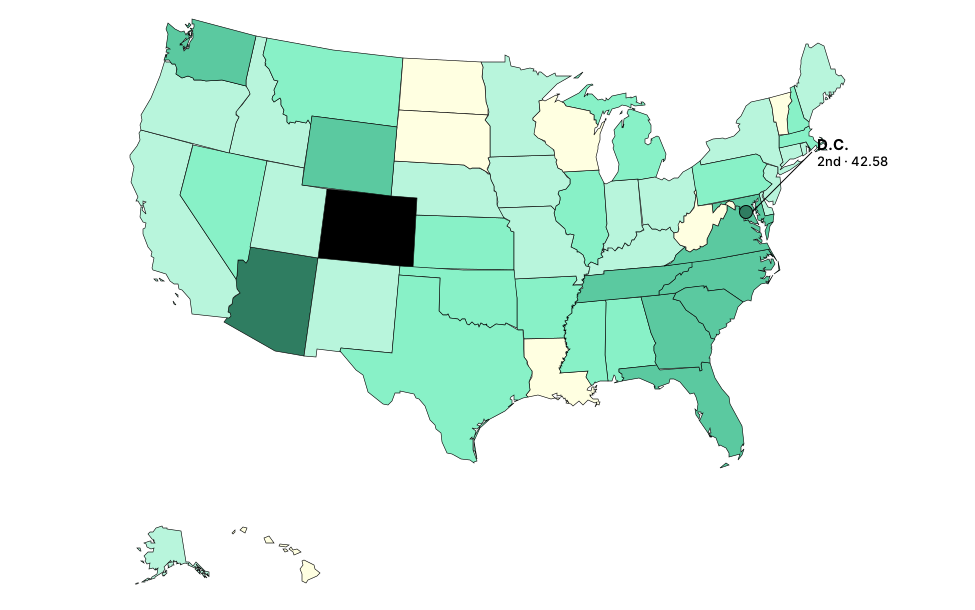
Colorado residents file more unwanted call complaints per person than anyone else in America, at nearly eight times the rate of Hawaii. We ranked every US state and the District of Columbia using Federal Communications Commission complaint data, adjusted for population.
Raw complaint numbers tell you very little. The states that file the most unwanted call complaints are simply the states with the most people in them. California tops that list every year, and it isn't news.
Adjust for population and the picture inverts. California drops to 26th. Texas falls from third to 22nd. New York, seventh by raw volume, lands at 41st, the largest fall in the country. Meanwhile Wyoming climbs 37 places and the District of Columbia climbs 41.
The table below ranks all 51 jurisdictions by complaints per 100,000 residents, using nine months of FCC data from December 2025 to August 2026, compared against the same nine months a year earlier.
Every state ranked
Sort by any column. Scroll sideways on a phone.
| Rank▲ | State | Complaints | Per 100,000 residents | Year over year | Rank by raw volume |
|---|---|---|---|---|---|
| 1 | Colorado | 5,664 | 95.07 | +57.3% | 4▲3 |
| 2 | District of Columbia | 299 | 42.58 | +3.8% | 43▲41 |
| 3 | Arizona | 3,215 | 42.40 | +18.7% | 12▲9 |
| 4 | Maryland | 2,578 | 41.16 | +21.3% | 16▲12 |
| 5 | Washington | 3,265 | 41.03 | −10.2% | 11▲6 |
| 6 | Virginia | 3,566 | 40.47 | +13.1% | 10▲4 |
| 7 | Tennessee | 2,885 | 39.92 | +4.2% | 14▲7 |
| 8 | North Carolina | 4,402 | 39.85 | −5.8% | 5▼3 |
| 9 | Wyoming | 233 | 39.65 | +7.9% | 46▲37 |
| 10 | Florida | 8,827 | 37.77 | +12.3% | 2▼8 |
| 11 | South Carolina | 1,961 | 35.79 | +19.4% | 19▲8 |
| 12 | Georgia | 3,861 | 34.53 | +9.5% | 8▼4 |
| 13 | Pennsylvania | 4,307 | 32.93 | +15.6% | 6▼7 |
| 14 | Nevada | 1,076 | 32.93 | −8.2% | 26▲12 |
| 15 | Massachusetts | 2,261 | 31.68 | −12.7% | 18▲3 |
| 16 | Mississippi | 907 | 30.82 | +16.4% | 30▲14 |
| 17 | Alabama | 1,566 | 30.36 | +1.3% | 20▲3 |
| 18 | Arkansas | 933 | 30.21 | +30.5% | 29▲11 |
| 19 | Illinois | 3,777 | 29.72 | +1.4% | 9▼10 |
| 20 | Michigan | 2,874 | 28.34 | −7.8% | 15▼5 |
| 21 | Kansas | 835 | 28.11 | −0.9% | 33▲12 |
| 22 | Texas | 8,759 | 27.99 | +3.5% | 3▼19 |
| 23 | Oklahoma | 1,140 | 27.84 | −27.8% | 25▲2 |
| 24 | New Hampshire | 385 | 27.32 | −26.1% | 39▲15 |
| 25 | Montana | 307 | 27.00 | −9.7% | 42▲17 |
| 26 | California | 10,490 | 26.60 | −2.3% | 1▼25 |
| 27 | Delaware | 276 | 26.24 | +6.6% | 44▲17 |
| 28 | Idaho | 525 | 26.23 | −6.1% | 36▲8 |
| 29 | New Jersey | 2,460 | 25.89 | −6.9% | 17▼12 |
| 30 | Utah | 875 | 24.97 | −9.6% | 32▲2 |
| 31 | Ohio | 2,911 | 24.50 | −19.1% | 13▼18 |
| 32 | Missouri | 1,515 | 24.26 | −23.9% | 21▼11 |
| 33 | Maine | 340 | 24.20 | −47.6% | 40▲7 |
| 34 | Rhode Island | 266 | 23.91 | −15.0% | 45▲11 |
| 35 | Oregon | 1,021 | 23.90 | −6.2% | 28▼7 |
| 36 | Nebraska | 477 | 23.79 | −4.2% | 37▲1 |
| 37 | Kentucky | 1,047 | 22.82 | −6.9% | 27▼10 |
| 38 | Iowa | 735 | 22.67 | +5.5% | 35▼3 |
| 39 | Alaska | 164 | 22.16 | −9.9% | 49▲10 |
| 40 | Indiana | 1,487 | 21.48 | −18.2% | 22▼18 |
| 41 | New York | 4,235 | 21.32 | −4.6% | 7▼34 |
| 42 | Connecticut | 783 | 21.31 | −37.2% | 34▼8 |
| 43 | Minnesota | 1,171 | 20.21 | +8.4% | 23▼20 |
| 44 | New Mexico | 430 | 20.19 | −2.7% | 38▼6 |
| 45 | Louisiana | 904 | 19.66 | −68.5% | 31▼14 |
| 46 | Wisconsin | 1,155 | 19.38 | −15.5% | 24▼22 |
| 47 | South Dakota | 178 | 19.25 | +35.9% | 47— |
| 48 | West Virginia | 332 | 18.76 | −7.0% | 41▼7 |
| 49 | Vermont | 100 | 15.42 | −53.1% | 50▲1 |
| 50 | North Dakota | 97 | 12.18 | −24.2% | 51▲1 |
| 51 | Hawaii | 175 | 12.10 | −22.2% | 48▼3 |
104,032 complaints from December 2025 to August 2026, against 104,935 in the same nine months a year earlier. National rate 30.59 per 100,000.
Methodology
What we measured
We counted consumer complaints about unwanted calls filed with the Federal Communications Commission, then divided by state population to produce a rate per 100,000 residents.
Source data
Complaint data comes from the FCC Consumer Complaint Data Center, a public database of consumer complaints filed with the Commission. We filtered to the “Unwanted Calls” issue category and retrieved the data on September 11, 2026.
Population figures are US Census Bureau state population estimates, Vintage 2024.
Period covered
December 2025 to August 2026, nine months. Year-over-year comparisons use the identical nine calendar months of the previous year, December 2024 to August 2025.
Why nine months rather than twelve
The FCC dataset contains a collection gap in October 2025. Just 36 complaints were recorded nationally that month, against a monthly average of roughly 11,000 either side of it. November 2025 is also unusually low.
Any twelve-month window ending in 2026 includes that gap, and doing so produces an apparent national decline of around 11% that reflects missing records rather than fewer complaints. Excluding the affected months and comparing nine like-for-like months against nine shows complaints are close to flat nationally, down 0.9%.
We have published this rather than quietly worked around it, because anyone checking the underlying data will find the same gap.
What this data does and does not show
Complaints measure reporting behavior, not call volume. A state where more people take the time to file a federal complaint will rank higher than a state receiving the same number of calls where fewer people report them. This index measures how many Americans were annoyed enough to formally complain, which is related to, but not the same as, how many unwanted calls were placed.
That distinction matters most for the outliers. Colorado's rate is more than double the next highest state and rose 57% year over year. That increase is spread consistently across six or more consecutive months rather than appearing as a single spike, so it is a real pattern in the data. Whether it reflects a genuine rise in unwanted calls to Colorado numbers or a state-level push encouraging people to report them cannot be determined from this dataset alone.
What is not included
This index covers complaint volume only. It does not incorporate financial losses, which are recorded separately by the Federal Trade Commission using a different methodology and are self-reported.
Using this data
The full dataset is available to download below. Free to use — just credit Burner.
Download the data
The complete dataset, all 51 jurisdictions, as a CSV.
Free to use — just credit Burner.
“We rely on our phone numbers more than ever. It’s how we talk to friends, book doctor’s appointments and get into our bank accounts. We shouldn’t have to pay for that convenience by getting spammed and scammed. That’s where Burner comes in: a number you can give out but don’t have to answer to.”
You’ve seen the numbers. Keep yours to yourself.
Stay connected without making your personal number everyone’s point of contact. Burner helps put you in control of who can reach you.
Get a second numberPress
For data, interviews, or commentary, contact natalia@adhoclabs.co.